v2.2 [Mar 5, 2014] - Added a lagplot, 4-plot, BoxCox normality plot, BoxCox linearity plot, and BoxCox transformation.
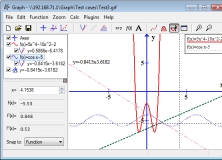
It can be used to draw mathematical graphs in a coordinate system.
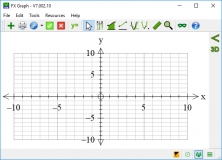
Present your data in 2D/3D graphs and perform statistical analysis.
Graph Cartesians, polars, parametrics, slope fields, volumes of rotation.
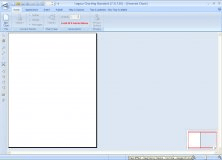
Create good looking family tree charts.
Start creating amazing ancestor charts.